Gold buyers struggle inside rising wedge on Fed day
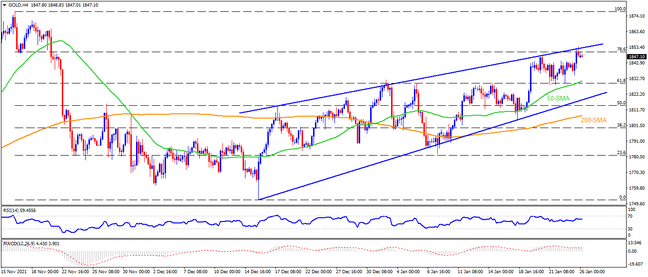
While a year-long resistance line has been testing gold buyers for one week, a six-week-old rising wedge bearish chart pattern teases sellers as markets brace for the Fed’s verdict. Given the sluggish RSI and receding bullish bias of the MACD, bears await a downside break of the $1,828 mark, comprising 50-SMA and 61.8% Fibonacci retracement of November-December downside. Following that, the lower line of the stated wedge near $1,816 becomes crucial as it holds the key to a slump towards September’s low near $1,721. During the fall, the 200-SMA level of $1,806 and $1,760 may offer intermediate halts.
Alternatively, an upside break of $1,848 will lure buyers but an upper line of the wedge, around $1,851, may test the run-up towards the $1,900 threshold. Also acting as upside filters are the tops marked in November and March months of 2021, respectively around $1,877 and $1,916.
On a fundamental side, the Fed is widely anticipated to hint for March rate hikes and balance-sheet normalization amid inflation fears. That said, a slight disappointment is enough for gold to rally towards $1,900 but the bears are so far trying to battle bulls amid hawkish hopes. Hence, it’s better to wait for the actual outcome.
