Major Forex Trading Indicators

Indicators are a fundamental part of technical analysis, a discipline helping traders to evaluate investments and identify trading opportunities in price trends and patterns. In some cases, trading opportunities can be easily identified with the help of correct interpretation of one of the major Forex indicators.
Technical indicators are mathematical tools that analyze one of the five following figures: open price, high price, low price, closing price, trading volume. The calculation result is plotted as a chart pattern. You may have seen those charts before: some of them overlay the price chart, others are drawn in a separate window. Although there are thousands of indicators, only a few of them are highly helpful to analyze the market sentiment. Besides, traders should realize that anybody with coding skills can create an indicator, that will have no actual use for you.
In this article, we are going to look through the most popular Forex indicators. Remember that rigorous examination the indicator you are going to use and knowing it's strength and weakness is the key to smooth trading.
Keep reading to learn about:
- Trend Indicators (ADX, MACD, and Aroon)
- Momentum Indicators (RSI and Stochastic Oscillator)
- Volatility Indicators (ATR and Bollinger Bands)
- Volume Indicators (OBV)
Trend indicators
Trend indicators help defining the prevailing direction (the trend) of the price moves by smoothing price data over a certain period of time.
ADX - Average Directional Movement Index
Reflects trend strength, compares whether the bull or the bear is stronger today. A lagging indicator.
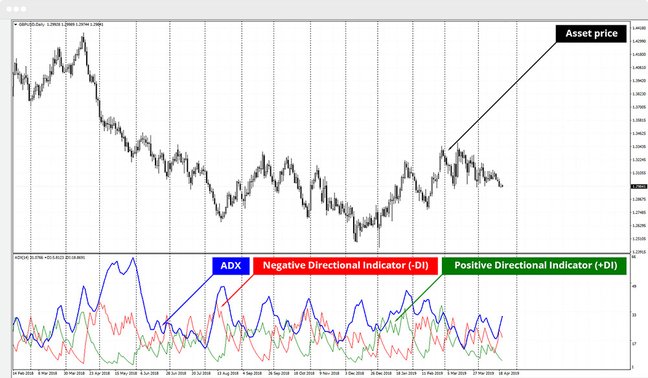
There are two indicators that form up the ADX Indicator:
- the +DI (Directional Movements) tells us how strong the bull is today, compared to yesterday
- the -DI informs us as to how strong the bear is today, compared to yesterday
The ADX chart with the +DI and the -DI looks like three lines entangled with each other, moving on the scale from 0 to 100.
- If the ADX is below 20, the trend is supposed to be weak, no difference if bearish or bullish
- ADX below 40 indicates a trend strength
- ADX above 50 reflects a strong trend
Every technical indicator that jumps up and down in a set scale is oscillating. That's how even the trend indicators may be oscillators in terms of their characteristics.
Download the best trading software for Forex trading for free and start trading today!
MetaTrader 4 is compatible with any OS, and can be run on any device wherever you are.
Aroon
Measures the presence of a trend, it's strength and development. A lagging indicator.
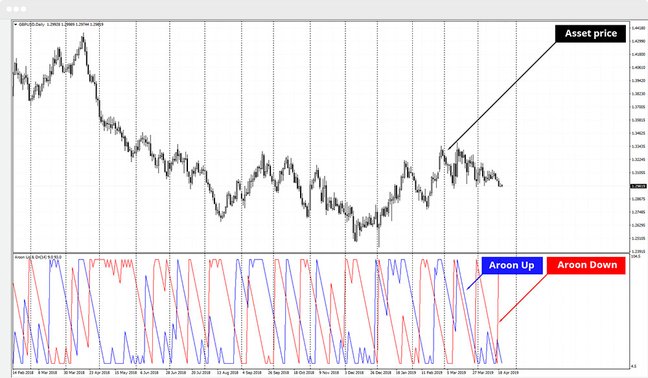
Aroon indicators are based on the highest highs and lowest lows. Simply, it evaluates how recent were the previous maximum and minimum peaks. The bullish line reflects the remoteness of the highest high, while the bearish does the same to the lowest lows.
Additionally, lines oscillate from 0 to 100. If the bullish line is pressed to the top of the scale around the 100 marks, and the bearish line is barely above the bottom at 0 that means that higher highs are happening more often, while lower lows are quite seldom. That indicates that we have a strong bullish trend. Crossovers indicate trend direction change.
Moving Average Convergence/Divergence (MACD)
Reveals changes in the strength, direction, momentum, and the duration of a trend. Meant to be used on daily charts, similar to using a lagging indicator.
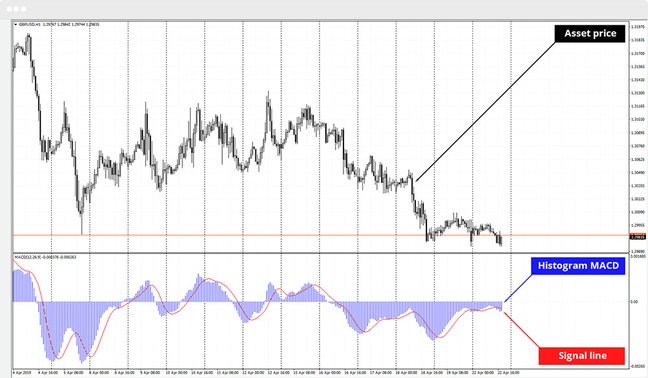
MACD is built upon moving averages of 12 and 26 periods, but with some interesting alterations. Regardless of the alterations, the indicator consists of the MACD line - the difference between the 12 EMA (Exponential Moving Averages) and 26 EMA, the signal line - the same MACD line smoothed by a nine-period SMA, and the histogram, which is the difference between the MACD and the signal. The histogram (the bars along the 0 axis) is often used to identify divergences. A divergence occurs when the price makes a higher high or a lower low that is not supported by the histogram, also making a higher high or a lower low, accordingly. A divergence points at the change in the price direction.
up to 200%

from 0 pips

Trading platform
Momentum indicators
The Momentum Indicator measures the rate of change or speed of price movement of a certain financial instrument.
Relative Strength Index (RSI)
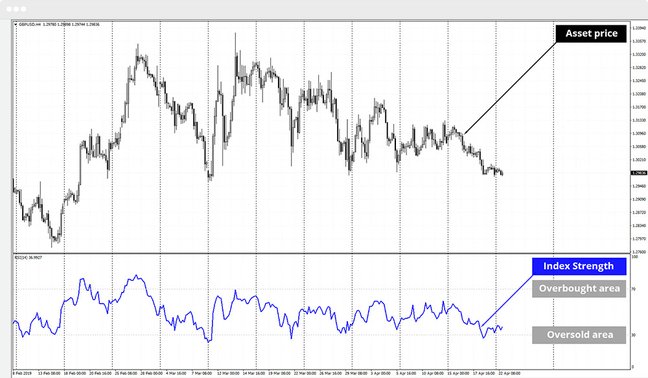
Signals if an instrument is being overbought or oversold, by measuring the velocity and the magnitude of price movements.The Relative strength index (RSI) indicator is the first in the group of momentum indicators next to the Williams %R (Williams Percent Range) and the Stochastic, that serves the same basic purpose, but through slightly varying methods. Momentum is nothing else than the rate of price change.
What does RSI do? It compares the closing prices of the current and previous candles for the up and down trends. The result is turned into EMA or SMA (Simple Moving Average) in some cases and then evaluates the relation of the uptrend EMA to the downtrend EMA.
Then it is calculated how the uptrend EMA relates to the downtrend EMA when oscillated on a 1 to 100 scale. The bigger the difference between today and yesterday - the stronger the momentum.
If every future close signal is higher than the previous one, the RSI will be oscillating upward. As soon as it surpasses the threshold of 80, the sell signal is produced.
If the price makes a higher high, while the RSI only makes a lower high, a bearish signal is generated and vice versa.
Stochastic Oscillator
Helps to identify overbought and oversold areas through measuring momentum. Evaluates how close the closing price was to the price range.
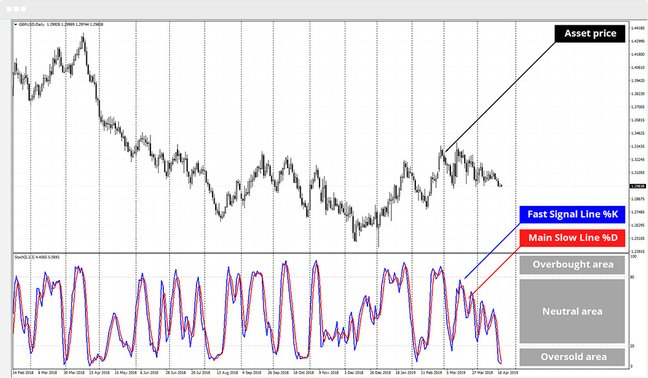
During the uptrend, the price should be closing near the highs of the trading range and near the lows during a downtrend. The Stochastic Oscillator is plotted in a 0 to 100 corridor, with basically the same 80/20 overbought/oversold thresholds.
The Williams %R compares today's closing price to the highest price in the past, and in relation to the average of the high and low in the past. In all other respects, it functions like the RSI and the Stochastic.
Volatility indicators
They measure the changes in market prices over a specified period of time. The faster prices change, the higher is the volatility.
Average True Range (ATR)
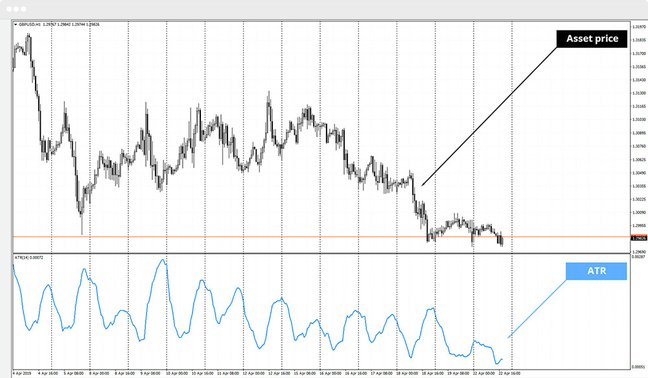
Measures market volatility by decomposing the entire range of an asset price for the period.
Range = Today's high - Today's low
The true range extends it to yesterday's closing price if it was outside of today's range. The Average True Range Indicator is an EMA of the true range.
ATR is formed out of the greater of the following:
- The current high minus the current low
- The absolute value of the current high less than the previous close
- The absolute value of the current low less than the previous close
The bigger the price difference between one of the above, the higher the ATR goes, and the higher is the volatility on the market. ATR can be used when adjusting trading stops.
Bollinger Bands
Uses an SMA or an EMA, and then envelopes it by two standard deviation lines.
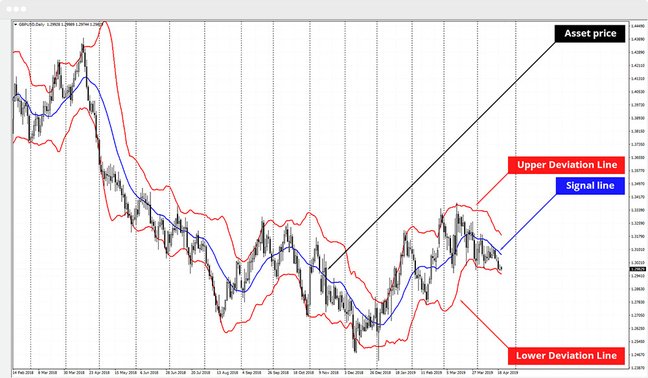
Bollinger Bands is another volatility indicator that creates a dynamic corridor for the price to bounce in. According to Mr Bollinger idea, prices are higher near the upper deviation line and lower at the lower deviation line, which hints at a turnaround.
Following Mr Bollinger's idea, prices are high when near the upper deviation line, and low at the lower deviation line.
Volume indicators
A precise estimation of the spot Forex market volume is impossible in contrast to stocks, Forex futures, and commodities. The problem is that a single clearing location to recalculate volumes does not exist because Forex spot is traded over-the-counter (OTC). The trading volume available at a certain platform depends on the broker's own data stream. Those numbers bear no relation to the total worldwide trading volume. Nevertheless, some traders still use volume indicators in trading and some even benefit on it.
On-Balance Volume (OBV Indicator)
Measures increase/decrease in the volume of a traded instrument in relation to its price.
If a total daily volume has increased compared to the previous day, it is assigned a positive number. If the total volume has decreased since the previous day, it is supposed negative. When prices go strongly in one direction, so goes OBV. A divergence between the price and the OBV indicates a weakness in the market move.
If while further researching the wide range of technical indicators you meet many similarities among indicators mentioned above and the new ones, compliment yourself. That means you have not only grasped the mechanical execution of the generated trading signals but also comprehended their logic and market application. Improve your trading experience with our free demo account.
Stay tuned! Follow the updates in our Education section.
- Find out how to benefit from falling price;
- Read about the Grid Strategy on Forex.
This material does not contain and should not be construed as containing investment advice, investment recommendations, an offer of or solicitation for any transactions in financial instruments. Before making any investment decisions, you should seek advice from independent financial advisors to ensure you understand the risks.
