What Is The MACD Indicator In The Stock Market?
This article will explain what the MACD indicator is, as well as outlining how it can be read and interpreted on charts, how it is calculated, which settings are typically used for it, how it can be useful for trading within the stock markets, and important points to keep in mind when using it.

What is the MACD Indicator?
The MACD (Moving Average Convergence Divergence) trading indicator is a highly popular, technical analysis tool used by professional traders.
The MACD indicator is also part of a range of technical analysis indicators known as 'momentum oscillators', which are designed to track high and low movements between two extreme values, and this information is then used to create a trend indicator that will fluctuate between these two extreme regions.
The MACD indicator measures the features of a trend, such as the direction of a trend (moving in a bullish or bearish direction), the amount of the trend (how significant or minor the trend is), and the speed at which it is occurring.
MACD indicators are often used by professional traders for following trends and reviewing potential price reversals (i.e. when the price changes direction and goes from bearish to bullish, or vice versa).
Understanding MACD Indicators on Charts
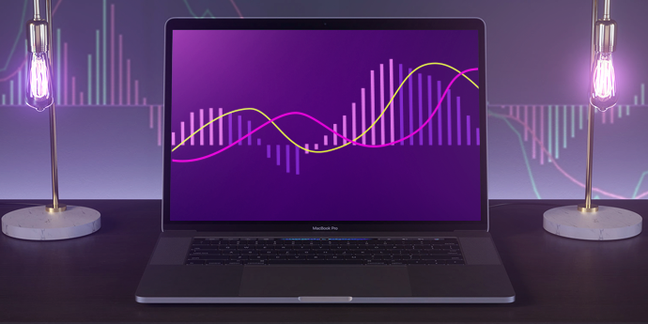
MACD indicators use two different trend lines, and the points at which they cross are typically referred to as 'trading signals', which are regarded as opportune points at which the trader might want to consider buying or selling.
MACD indicators use three different 'series' known as:
- The MACD series: the difference between a longer exponential moving average (EMA) and a shorter EMA
- The average/signal series is the EMA of the MACD series
- The divergence series represents the differences between the MACD series and the average series
Moreover, the difference between the MACD line value in comparison with the signal line is what's known as a 'MACD Histogram'.
The range of different signals that are given out by the MACD indicator are, which we mentioned previously, signals that indicate to traders when they should trade, but ultimately these signals are used to predict the market trends.
Therefore, it's arguably best to use several different indicators at the same time, in order to ensure that signals are more likely to be correct.
up to 200%

from 0 pips

Trading platform

MACD Settings
MACD indicators are set up using letter variables (which represent different periods of time) (i.e. a,b,c). The 'a' and 'b' variables represent the periods in time which are used to calculate the MACD series.
These variables are subtracted from each other (for example, the short EMA minus the long EMA). This then represents one line on the chart. The variable 'c' refers to the time period in which the EMA was taken within the MACD series.
The default parameters that are typically used for MACD indicators are: (12,26,9). You will usually find that nearly all forms of charting software platforms will contain these parameters as the default settings.
The points at which these lines converge or diverge from each other represent opportunities (or trading signals) to traders, either to buy or sell.
When Should You Trade Using Trading Signals?
The moving average crossover point occurs when the signal line and the MACD line cross each other. Traders will receive many different signals when using the MACD indicator, but it is recommended to trade in response to the signals when the following two outcomes occur:
- If the MACD sits beneath the zero line and the signal line has crossed above the MACD line. At this point, traders should avoid going for a long position.
- Traders should also avoid making a sell trade if the MACD sits above the zero line while the signal line is crossed with the MACD line.
MACD Indicator Formula
To calculate the MACD (approximately), try using the following formula:
- 12 period EMA - 26 period EMA
The smaller (or shorter) EMA (Exponential Moving Average) will be frequently either diverging or converging from the larger (or longer) EMA.
This movement pushes the MACD to oscillate at the zero level. From there onwards, a signal line is created which contains a 9 period EMA from the MACD line.
This is a default calculation, so make sure that you change the parameters so that they fit your chart information.
Using the MACD Indicator in the Stock Market
Since there is a slight lag in the indicator, it is best used for trading stocks, bonds, indexes, and commodities. This is because they tend to move a little slower in comparison with other markets and instruments, such as the Forex market. Moreover, these types of investments tend to be more long term.
As the MACD indicator is based on moving averages, it can be used to predict or follow particular trends within the stock market. This can help traders to anticipate future drops or rapid increases in the values of stocks, or the overall markets.
Practice using the MACD indicator with a demo trading account:
Before you start using the MACD indicator to analyze potential upcoming trends or determine potentially winning trades, you might want to test it out first. With MTrading, you can set up a free demo trading account on the award-winning MetaTrader 4 trading platform.
You can gain access to real-time trading information, a range of different trading charts and indicators, and you can even trade with virtual funds, so that your capital is not at risk while you are learning and practising. Once you are ready, you can transition to a live trading account, where you can test your skills and knowledge in the live markets!
How to Add MACD Indicator to a Chart
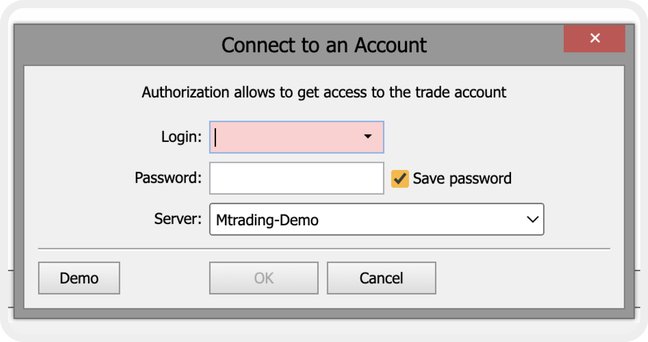
You can try to use the MACD indicator and try different settings right in the demo account without installation of MT4. To add MACD indicator to your chart, please log to your personal cabinet.

- Open a free Demo account if you don't have one or log in to existing one via WebTrader or MT4.
- Go to Dashboard. Find your Demo account and click on Show password -> Trade Now

3. WebTrader will launch automatically. If not, login with demo credentials.

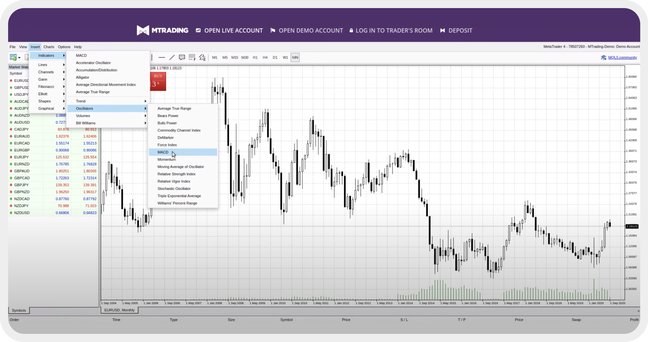
4. Go to Insert -> Indicators -> Oscillators - MACD
Things to Keep in Mind
Avoid false signals
Whenever you receive trading signals, it is important to analyze them in comparison with other indicators or through the use of other forms of analysis (e.g. fundamental analysis).
This way, you can reduce the likelihood of incorrectly trading with false signals, and you can see if patterns emerge between the two different data sets.
For instance, if you have several indicators running at one time which are all indicating a particular trading signal, then it might be the best time to trade. But if you have one indicator suggesting to trade on a particular signal, whilst another suggests otherwise, it might be best to avoid trading in response to it.
Use other indicators as well
Since the MACD indicator is a technical analysis tool, it does not take into account other equally important factors, such as economic data releases, or news developments.
This means that if you are solely relying on the MACD indicator to indicate which trades you need to make, you might be failing to take into account key data and trading information that could change everything.
With this in mind, it might be best to perform some extensive research and find other indicators that factor in this information and data. This way, you can compare the information you receive from several different indicators, and therefore, you may be in a better position to make a more informed trading decision.
This material does not contain and should not be construed as containing investment advice, investment recommendations, an offer of or solicitation for any transactions in financial instruments. Before making any investment decisions, you should seek advice from independent financial advisors to ensure you understand the risks.
