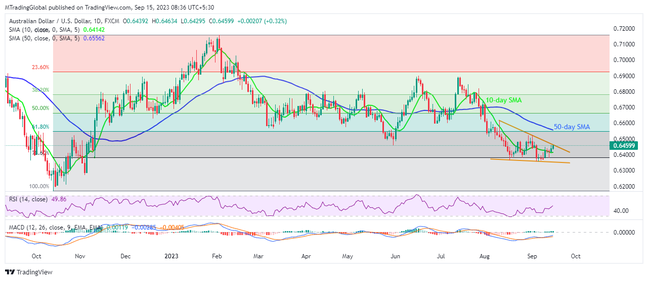
Strong China data and a clear upside break of the 10-day SMA allow AUDUSD buyers to prod the resistance line of a five-week-old descending triangle on early Friday. Adding credence to the Aussie pair’s upside bias is the upward-sloping RSI (14) line, not overbought, and the bullish MACD signals. With this, the risk-barometer pair is likely to cross the immediate hurdle surrounding 0.6460, which in turn will open the door for the pair’s run-up toward the 50-day SMA level of around 0.6560. It’s worth noting that the 0.6500 round figure and the 61.8% Fibonacci retracement of October 2022 to February 2023 upside, near 0.6550, act as extra upside filters to watch during the quote’s further upside. In a case where the pair price remains firmer past the 50-DMA, the lows marked in late June and early July around 0.6600 will act as the final defense of the bears.
Meanwhile, the AUDUSD pair’s failure to provide a daily closing beyond 0.6560 could drag it back to the 10-day SMA level of surrounding 0.6415. However, the 78.6% Fibonacci ratio and the stated triangle’s bottom line, respectively around 0.6380 and 0.6355, will test the Aussie pair sellers afterward. Should the quote stay weak past 0.6355, the November 2022 low of around 0.6270 and the previously yearly bottom of around 0.6170 will lure the sellers.
To sum up, the AUDUSD pair is likely to witness additional recovery but the upside room appears limited.
Join us on FB and Telegram to stay updated on the latest market events.