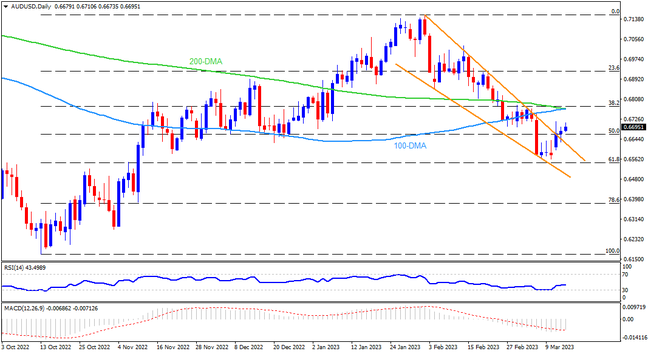
AUDUSD confirmed a falling wedge bullish chart pattern during the early days and is keeping the breakout so far during Wednesday. The RSI (14) line’s gradual rebound from the oversold territory adds strength to the upside bias. However, a convergence of the 100 and 200 DMAs, around 0.6770 at the latest, appears a tough nut to crack for the Aussie buyers to keep the reins. Following that, tops marked during December 2022 and mid-February 2023, respectively around 0.6895 and 0.7030, could act as intermediate halts during the theoretical target of 0.7240.
On the contrary, a downside break of the 0.6640 level, comprising the stated wedge’s top line, could negate the bullish bias. Even so, the latest swing low and the 61.8% Fibonacci retracement level of October 2022 to March 2023 upside, close to 0.6560 and 0.6545 in that order, could test the AUDUSD sellers before giving them control. Also acting as a downside filter is the lower line of the aforementioned bullish chart formation, near 0.6515 as we write.
Overall, AUDUSD is likely to rise further toward the previous monthly peak. However, the key DMA convergence challenges the buyers as top-tier Aussie data looms, up for publishing on Thursday.
Join us on FB and Telegram to stay updated on the latest market events.