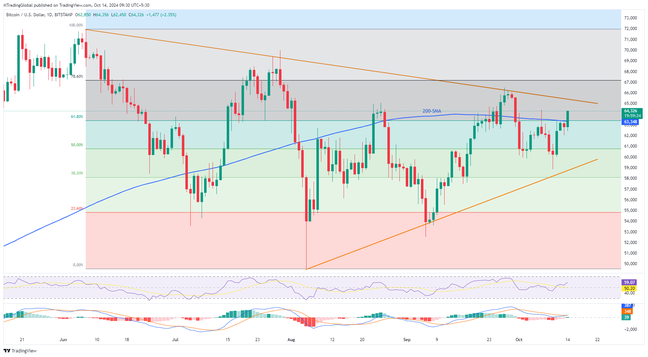
Bitcoin (BTCUSD) rises to a five-week high, crossing the 200-day Simple Moving Average (SMA) during a slow trading session on Monday, largely affected by holidays in Japan, the US, and Canada. Notably, Bitcoin formed a Doji candlestick on the weekly chart, hinting at a potential reversal of its losses from late September.
Further upside appears lucrative
In addition to the weekly Doji candlestick and Bitcoin's recent move above the key moving average, a bullish crossover on the MACD and a strong RSI (14) support BTCUSD buyers.
Key technical levels to watch
With Bitcoin (BTCUSD) successfully trading above the 200-SMA, buyers are gearing up for a challenge against a four-month-old descending resistance line near $65,450. The previous monthly high of around $66,500 also poses a barrier; breaking through this level could open the door for Bitcoin bulls to target the $70,000 mark, which was tested in July.
Conversely, sellers should watch for a drop below the 200-SMA, currently around $63,350. If this happens, the 50% Fibonacci retracement level from the June-August decline and an upward-sloping support line from early August, located near $60,800 and $58,750 respectively, will be crucial for buyers to defend.
US Dollar consolidation adds strength to bullish bias
In addition to the technical indicators, a quiet economic calendar this week and mixed data from the previous week could lead to the US Dollar’s retreat, which may help boost Bitcoin (BTCUSD) prices.
Join us on FB and Twitter to stay updated on the latest market events.

