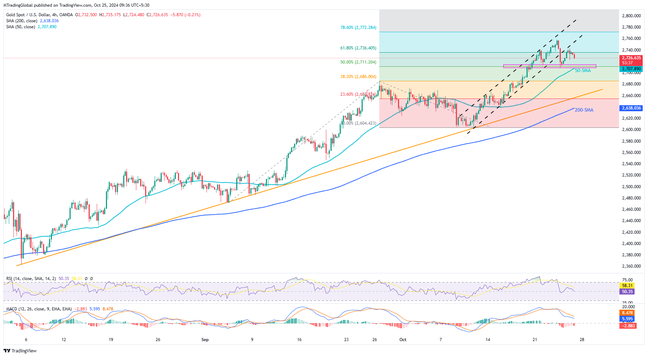
Early Friday, gold prices slipped after a brief bounce from a week-long support level, retreating from a point that has shifted from support to resistance. Traders are closely watching the September U.S. Durable Goods Orders. This movement highlights gold's defense against a mid-week rejection of a bullish trend, signaling the anticipated price pullback.
Sellers flex muscles
Gold is struggling to regain momentum, facing rejection from recent highs. With bearish signals from the MACD and an RSI close to 50, further declines in gold prices seem likely. However, strong support levels may challenge sellers' quest for lower prices.
Key technical levels to watch
In the past week, gold has seen multiple peaks and troughs, with the 50-day simple moving average (SMA) highlighting $2,715-$2,710 as a crucial support zone for sellers. Below that, the 38.2% Fibonacci Extension of gold's movements from September to October and the previous monthly high near $2,686 could attract bearish interest. Importantly, the upward-sloping trend line from early August and the 200-day SMA, around $2,657 and $2,638, respectively, will serve as final defenses for buyers before control shifts to sellers.
On the upside, gold buyers are looking for confirmation from the lower boundary of the bullish channel, around $2,753. A successful breakout could lead to a rise towards the recent peak of $2,758 and potentially up to the channel’s upper line near $2,790. The 78.6% Fibonacci Extension at $2,772 and the $2,800 mark are additional upside filters to watch for the XAUUSD bulls.
Bulls run out of steam
Despite several strong support levels, the anticipated strength of the US dollar after upcoming economic data and recent technical consolidations indicate a potential short-term decline in gold prices. However, the overall bullish trend remains intact unless prices fall below $2,638.
Join us on FB and Twitter to stay updated on the latest market events.

