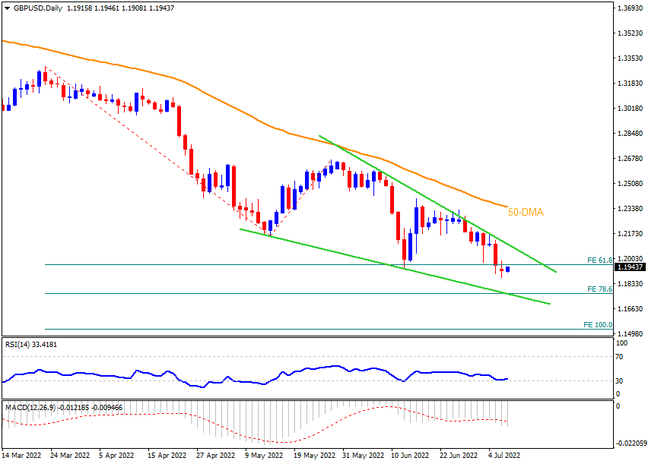
Be it recession fears or the UK’s political crisis, GBPUSD has to bear it all as it dropped to the lowest level since March 2020. However, the cable pair appears to have a limited downside room before hitting the key supports. That said, a nearly oversold RSI and a falling wedge bullish chart pattern near the multi-month low also tease buyers to take the risk. It should be noted, however, that a downside break of the 1.1770 mark, comprising the wedge’s support line and 78.6% Fibonacci Expansion (FE) of late March-May moves, will defy the bullish hopes. Following that, the 100% FE level surrounding 1.1520 may offer an intermediate halt before dragging the quote to the year 2020 bottom close to 1.1410.
Meanwhile, recovery moves may initially struggle around the 61.8% FE level near 1.1950 before regaining the 1.2000 mark. Though, bulls will be interested in seeing a successful break of the 1.2100 mark as it confirms the falling wedge bullish formation. In that case, theory suggests a run-up towards the 1.2800 round figure but the 50-DMA and May’s top could challenge the buyers respectively around 1.2360 and 1.2565.
Overall, GBPUSD sellers appear to have run out of steam but the bulls need validation.
Join us on FB and Twitter to stay updated on the latest market events.

