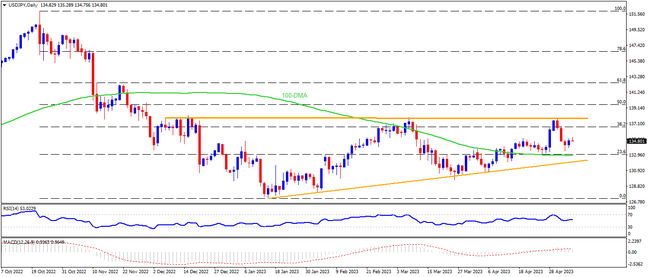
USDJPY marked the first negative weekly close in four despite Friday’s gains. Following that, the Yen pair remains inside an ascending triangle bearish chart formation comprising multiple levels marked since early December 2022. That said, the RSI and MACD conditions also signal a continuation of the recent rebound within the stated triangle. With this, the top line of the aforementioned chart formation, close to 137.80 at the latest, gains the market’s attention, a break of which could defy the bearish pattern and can propel prices towards the 61.8% Fibonacci retracement of October 2022 to January 2023 downside, at 142.50. It should be noted that the 140.00 round figure can act as an intermediate halt during the anticipated rise whereas a successful rise past 142.50 won’t hesitate to aim for the 78.6% Fibonacci retracement level surrounding 146.70.
Meanwhile, the 100-DMA joins the 23.6% Fibonacci retracement level to provide strong short-term support within the triangle around 132.80. Following that, the triangle’s lower line, close to 131.90, will be crucial to watch as a clear break of the same could confirm the theoretical fall towards 121.00. While chasing the said target, the lows marked during January 2023 and May 2022, respectively near 127.20 and 126.30, may act as intermediate halts. However, the USDJPY pair’s weakness past 121.00 could witness multiple supports around the 120.00 psychological magnet.
Overall, USDJPY is likely to decline further as Fed vs. BoJ divergence eases. Though, a clear downside break of 131.90 becomes necessary to convince bears.
Join us on FB and Telegram to stay updated on the latest market events.