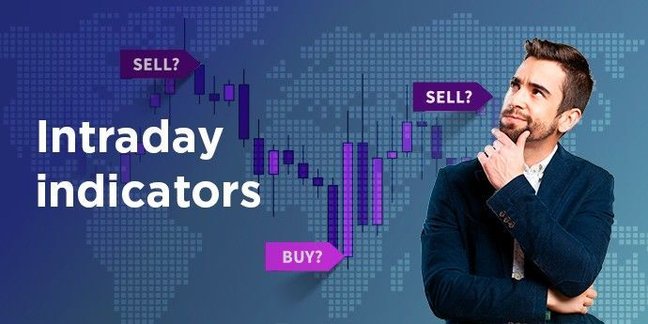
5 Best Indicators for Intraday Trading
Following the best indicators for intraday trading is the common practice for both beginners and experienced traders. While the concept of intraday trading generally considers buying and selling assets the same day, these indicators can be used to maximize profit as well as have a better overview and understanding of the financial market.

Despite the fact, short-term strategies often come with a greater risk; intraday trading indicators make the process more predictable and fascinating in reference to the total return on investment. In this article, we will review some of the leading indicators for intraday trading as well as how to decode them.
But first, let's find out how they may help traders when going short.
How Can Intraday Technical Indicators Help?
As we have stated earlier, they provide a better market overview for the nearest future. The indicators also make it simpler to understand in what direction the price or trend is going to move. Besides, they provide additional information that may include:
- Trend direction to define its future movement.
- Potential profits depending on the volatility.
- The timeframe for an existing or lacking momentum within the market you trade.
- Volume measurements to define the asset's popularity.
The above-mentioned pointers are very important whenever a trader wants to assess the market conditions and come up with faster and more effective decision-making, which is vital for the intraday trading strategy.
up to 200%

from 0 pips

Trading platform

Now, let's have a look at the most important indicators for intraday trading.
Top Indicators for Intraday Trading
We have conducted a list featuring all major technical indicators for the short-term trading strategy. They are as follows:
1. Moving Averages
Even if you are new to the financial market, you have probably heard about this particular indicator. Beginners and pros commonly use it as an essential element of their technical analysis. The method involves placing the average closing rates on a separate stock chart that contains a line associated with a specific period. Let's say, you trade a stock.
The chart depicts a stock movement at a long timeframe, which often means a more reliable moving average. Besides, this indicator makes it possible to apprehend the possible asset movement because stocks are pretty volatile.
2. Bollinger Bands
This indicator for intraday trading is a bit more advanced and complicated if compared to moving averages. It also uses trading charts with three different lines and the average closing rates depicted in the chart. The main idea is to show how the price can go upper or lower from its average.
3. Momentum Oscillators
If you decide to trade stocks, market volatility is the first thing you need to keep in mind. In other words, stock prices never stop moving up and down. This is where the best technical indicators for intraday trading will let you easily keep up with that movement.
Momentum oscillators are the only indicators that make it possible to determine the moment when stock markets are experiencing a short-term cycle no matter if it is being bearish or bullish at the moment. The indicator lets traders identify this particular scenario and decide if the market is going to experience some rapid changes in the nearest future.
4. Relative Strength Index (RSI)
A trader uses the RSI indicator when the task is to compare the share's price losses and gains. The necessary data is delivered in the form of an index that comes with the RSI scoring rate. It ranges from 0 to 100. Experts say that if the rate goes up to 70, it is the best moment to buy stocks.
If it goes down to 30, you are supposed to sell stocks. But you should avoid considering this particular concept as a rule. The best way is to do in-depth research and analysis of your own in advance.
5. Moving Average Convergence Divergence (MACD)
The last point in our list of best indicators for intraday trading is the MACD indicator. Traders generally use it to retrieve the information about the potential trend's movement. Besides, it shows the trend's movement duration and momentum.
The indicator uses two moving averages at the same time. They are divergent and convergent. If MACD comes up with a positive value, it means that the trend is likely to move upwards. If the value is negative, we are to expect a trend moving downwards.
Trade with the best platform. MTrading offers free MetaTrader 4 that you can use without installation, or download any of the versions for your device. Enhance your trading with MetaTrader 4 Supreme Edition, a special plug-in designed by MTrading.
Steps to Decode Indicators for Intraday Trading
Now. We need to figure out how to decode the above-mentioned indicators. In other words, we will try to learn how to use them under real-market conditions depending on your trading strategy.
- Moving Averages – if you see a chart with short-term averages exceeding the long-term ones, it means that that the indicator depicts a bullish market trend. It offers a great chance to choose the best entry position as well as the best place to use stop-losses.
- Bollinger Bands – if you trade a stock that is located below the indicator's line, its price is very likely to go up in the nearest future. It means that you are supposed to enter the market with a "buy" position. And vice versa, if the stock is over the indicator's line, you should take a "sell" position.
- Momentum Oscillators – this one is a bit more complicated to decode. Imagine the stock price reaching its historical height. At the same time, the oscillator level differs from the price. It means that the demand is about to decrease. What's more, the situation may result in a rapid and unexpected price fall.
- RSI – as we have stated earlier, experts recommend selling stocks when the RSI level reaches 70 and buy them when it drops down to 30. You should not take it as a golden rule, as some stocks may not adhere to this particular concept. You need to take into account the RIS history and market volatility before making a final decision.
The Bottom Line
Leading indicators for intraday trading help to avoid risks. They can be used to define the best market entry and exit position. What's more, they make it possible to use technical analysis when placing appropriate trades. Make the most of technical analysis, learn how to read trading charts, and plan your strategy in the most effective and risk-free way.
This material does not contain and should not be construed as containing investment advice, investment recommendations, an offer of or solicitation for any transactions in financial instruments. Before making any investment decisions, you should seek advice from independent financial advisors to ensure you understand the risks.
